ZetaView®
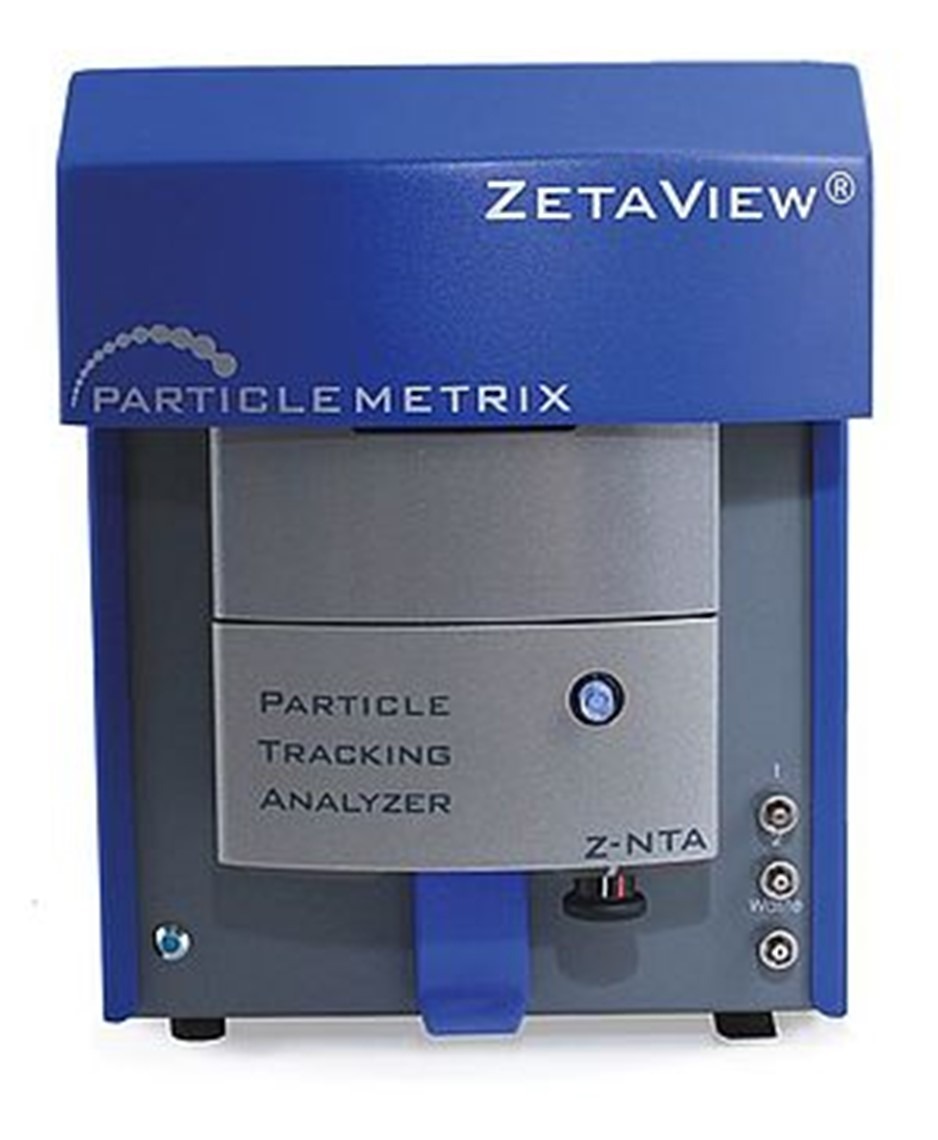
The ZetaView is a nanoparticle tracking analyzer (NTA) that performs a rapid in vitro measurement of multiple physical parameters such as size, concentration, surface charge, and phenotype characteristics for particles between 20nm and 1um. This system is commonly used by research institutions and biopharmaceutical companies to characterize extracellular vesicles such as exosomes, liposomes, protein aggregates, viruses, and nanobubbles. The ZetaView has two basic modes of operation: scatter measurement and fluorescence measurement. Scatter mode measures size, concentration, and zeta. Fluorescence mode does the same, but only for particles emitting fluorescence beyond the cutoff filter used allowing a more specified characterization (Figure 2). Systems with up to four channels of excitation (405, 488, 520, and 640nm) are available (Figure 3). Part of NTA’s popularity is due to its ability to precisely measure particle concentration in the nano range and is therefore commonly used by flow cytometry labs. In addition to that, these systems are also much more sensitive to differences than many other forms of nanoparticle analysis. This is because NTA characterizes single particles as opposed to the ensemble approach more common to nanoparticle size analysis. Many scientists find this sensitivity very useful and NTA can often help to explain anomalous data from other systems. This, as well as the specificity offered by fluorescence, makes the ZetaView a great orthogonal addition to pre-existing particle sizing capabilities. If you would like to learn more, please follow the link here or contact us.

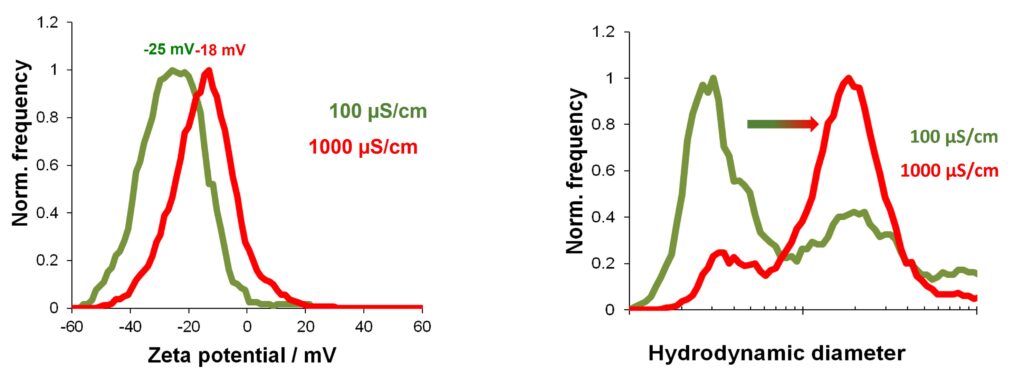
Figure 1. What are the benefits of determining the Zeta Potential for biological samples such as vesicles or viruses? What could a change in the surface charge mean?
To give you an idea of how useful the Zeta Potential measurement could be, let’s have a look at this little experiment we perform regularly in our lab. Freshly produced liposomes were resuspended in two different salt-containing buffers. A high salt buffer with a conductivity of 1000 µS/cm and a low salt buffer with a conductivity of 100 µs/cm. Both samples were analyzed for their Zeta Potential using the Particle Metrix ZetaView. The sample from the high salt buffer shows a significantly lower Zeta Potential in red compared to the liposomes resuspended in the low salt buffer in green. However, the differences in Zeta Potential are not huge. But the simultaneously performed size measurements show a different story. Keep in mind that the axis for the hydrodynamic size is in logarithmic scale not linear. So the measured size differences are huge and could be explained by aggregation processes of liposomes that happen in high salt environments. Mutually repellent charges on the surface of the liposomes are shielded by the salt ions. This allows the vesicles to come closer and finally aggregate.
Taken together this shows that the Zeta Potential could be used as an indicator for aggregation processes in the given sample.
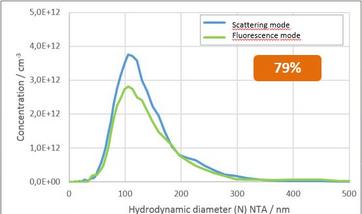
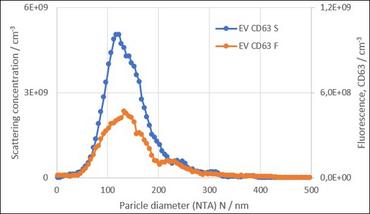
Figure 2. Two examples of scatter and fluorescence analysis of extracellular vesicles such as exosomes by ZetaView. For both graphs, the blue line shows the scatter measurement. A membrane stain was used on the left, showing ~ 79% of the particles were membranous. An immunostain was used on the right showing ~40% of the particles were CD63 positive.
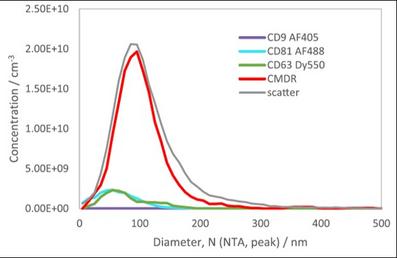
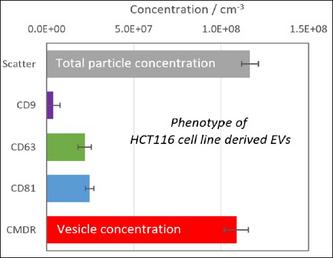
Figure 3. Here are five analyses performed on the same sample aliquot with a four laser QUATT ZetaView. A membrane dye was used (CMDR) as well as three different immunostains.

